- Eli's Newsletter
- Posts
- Key Metrics To Win Retail
Key Metrics To Win Retail
Eli Weiss
March 28, 2024
Hi Team,
Finally back on the East Coast, and hopefully staying still until mid-May. So much to talk about today, but a quick announcement before I kick off:
Over the last few years working at OLIPOP and Jones Road and consulting with close to 100 others, I’ve subscribed to hundreds of brands’ emails and SMS lists to get inspo for our own marketing campaigns.
The team here has been working hard on turning that inspo hunt into an easy-to-read, digestible weekly email highlighting the best marketers in DTC and their fav emails and texts they receive.
Some of the upcoming features are the brains behind Madhappy, Ilia, Huron, Ooni, Momofuku, Brooklinen, Everyman Jack, Cometeer, Jones Road, and so many more.
The first one went live last week and featured Anne from OLIPOP, and one today with Emma from Momofuku. I’d love for you to see it!
Check it out here.
Now, for this week, I’d like to address a very commonly asked question in CPG.
It goes something like this:
I have the most delicious beverage, cozy socks, best quality lipliner (fill in the blank,) but how do I know if it resonates with my customers?
What are my key metrics to look at as I build a CPG brand, retail-first or straight DTC?
I’m no guru, but I will share some learnings from my days at OLIPOP and what I have seen across the industry.
Maybe we keep this one to retail only?
IDK, let’s see where this goes.
Shall we dive in?

Before we get into it, a massive shout-out to Insense for sponsoring this week’s newsie.
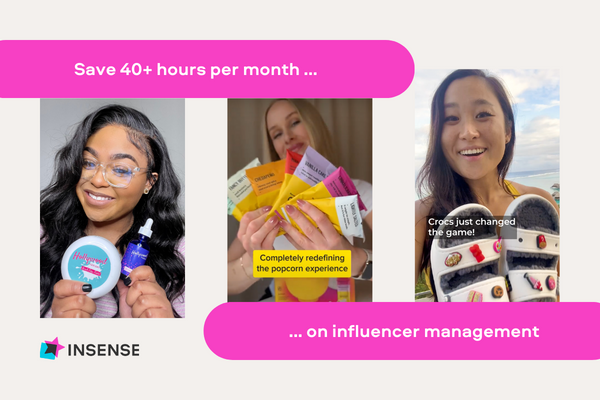
Save 40+ hours on UGC sourcing and influencer management
Are you using a creator marketing software but still struggling to scale?
Wish you had more people on the team to move faster?
Discover Insense, the influencer marketing software with a human touch
Marketers using Insense save an average of 40+ hours per month–time they reinvest in growing their business
On top of an easy-to-use platform, they also have a dedicated platform manager to handle your influencer and UGC operations:
Writing the creative briefs for your campaigns, on your behalf.
Hand-picking the best creators for your campaign.
Managing all communications with creators, from hiring to product shipment to getting final deliverables
Join 1,500+ major e-commerce brands like Opopop, Quip, GoPure, Woxer, Victoria Beckham Beauty, and Ivy Beauty using Insense to scale their UGC and influencer marketing operations.
Book a free strategy call and get $200 for your first campaign until April 12.
The CPG Brand’s Guide: Retail Edition
Say you started a CPG brand and nEtWoRkEd your way to early distribution. What are some numbers to look at?
I’m no guru, but I will share some things I’ve learned.
Sell-Through Rates: The Indicator of Demand
Sell-through rates directly show how well our products are moving compared to how much was initially stocked.
High sell-through rates signify that your products are not just occupying shelf space; customers are actively choosing them. It's a key metric for gauging product demand and market fit.
With a million brands vying for shelf space, it’s on you to make a case that your items sitting there are a good idea for the retailer, and if you can prove that, you might have other retailers interested as well.
If your social status or LinkedIn hype got your product on the shelf, but there is no demand… that’s probably trouble.
Sales Velocity: The Pace of Your Product
Sales velocity measures how fast your product sells within a certain period. This metric is crucial for understanding market demand and managing inventory efficiently.
A steady, rapid sales velocity indicates strong market demand and effective inventory turnover.
It’s obviously great if you have items that are perishable, but moreso a vital metric to show retailers that your products are going faster than others in the category and a reason to give you more space…
More granularly, most track units per store per week as well.
U/P/S/W helps measure the average number of units sold per store, shedding light on performance across different retail environments. It allows us to identify which stores and locations are most receptive to our products, helping tailor our distribution strategy to maximize sales.
Sales per Facing: Maximizing Shelf Efficiency
This metric evaluates how effectively and efficiently your product uses its allocated shelf space to generate sales.
High sales per facing mean your product is not only catching the eye of the shopper but also compelling them to purchase. It’s an essential metric for optimizing product placement and merchandising.
It makes a case for store managers to give you even more facings, as for each facing they give you, you drive x more revenue than similar facings.
Bonus if you are adding revenue to a stagnating section that is not cannibalizing other products in categories.
In addition to these numbers, I will say that having a great analyst on your team who can make a compelling pitch to other retailers based on your data is incredibly important.
I’ve seen so many wins from showing key data points.
As an example, OLIPOP shared a stat the other week that their Root Beer is selling “better” than the Root Beer daddy A&W. I imagine it is in a specific region or specific sort of retailer, but finding stats like this are super important to tell a story.
Slicing and dicing data to tell a compelling story will help you more in retail distro than you think.
Two Other Important Learnings:
1. We glamorize doors of distribution:
Just like raising a round of capital should not be celebrated the same way actually winning should be, getting more distribution is not always the win you think it is.
We just launched nationwide at Walmart isn’t quite the flex you think it is if you can’t actually sell through your $9.99 gummy bears in Walmart in Alabama.
Companies like OLIPOP strategically went after specific distribution before others so that by the time we got to a Walmart contract, the brand and category grew mainstream enough so that customers would be okay paying $2.49 for a “healthy soda” in middle America.
I can count 3 or 4 brands I know personally that were not able to sustain nationwide distribution and grew to fast distro-wise.
They launched nationwide
Took out debt to cover the mass production
Shipped to 10-20k stores they prob should not be selling at yet
Could not sell through a fraction of their product
Used “creative” ways to get their existing DTC customers to buy in retail
These creative ideas solved a problem very temporarily
They got cut from the distributor and lost lots of $ on inventory
They were unable to get future distribution (99% of sales data is “publicly available” via SPINS etc)
2. Being on the shelf does not mean you are selling:
A follow-up to point one. Even if you are a well-known brand, being “on the shelf” does not always mean you are selling.
Some examples:
A. Chaos ensues with competitors. We had competitors removing our cans and putting their own in front, so customers had no idea we existed.
B. If your velocity moves quickly, shelves will often be empty. Store employees won’t always stock shelves on the hour, and if you have limited facings and quick turnover, your shelf will often be empty, even though there is stock in the back.
Some handle this by asking their fans to help; others have a ton of sales members in the field, and some use services like Dirty Hands to help.
Sustainable and real growth >> twitter-fueled fake hype.
Skipping a few rungs to get to the top is rarely a good long-term strategy for both your career and for your retail expansion.

That’s all for this week!
Any topic you’d like for me to write about in the future?
Reply to this email.
Cheers,
Eli 💛